
Page 133 - ICD-AR22-English
P. 133
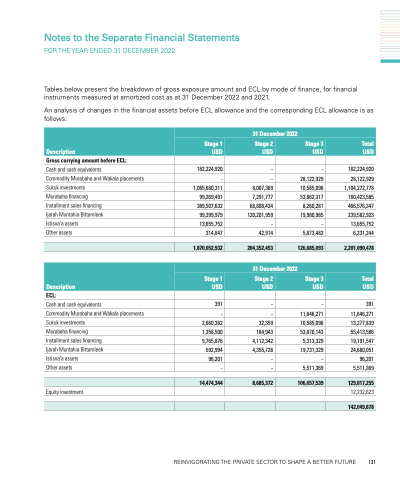
    Notes to the Separate Financial Statements
FOR THE YEAR ENDED 31 DECEMBER 2022
Tables below present the breakdown of gross exposure amount and ECL by mode of finance, for financial instruments measured at amortized cost as at 31 December 2022 and 2021.
An analysis of changes in the financial assets before ECL allowance and the corresponding ECL allowance is as follows:
        Description
  31 December 2022
   Stage 1 USD
   Stage 2 USD
   Stage 3 USD
  Total USD
  Gross carrying amount before ECL:
Cash and cash equivalents
Commodity Murabaha and Wakala placements Sukuk investments
Murabaha financing
Installment sales financing
Ijarah Muntahia Bittamleek Istisna’a assets
Other assets
ECL:
Cash and cash equivalents
Commodity Murabaha and Wakala placements Sukuk investments
Murabaha financing
Installment sales financing
Ijarah Muntahia Bittamleek Istisna’a assets
Other assets
182,224,920
- 1,085,680,311 99,269,491 389,507,632 99,399,979 13,655,752 314,847
391
- 2,660,382 1,358,500 9,765,876 592,994 96,201 -
-
- 8,007,369 7,291,777 68,808,434 120,201,959 - 42,914
-
- 32,359 184,943 4,112,342 4,355,728 - -
-
28,122,929
10,585,098
53,862,317
8,260,281
19,980,985
-
5,873,483
-
11,646,271
10,585,098
53,870,143
5,313,329
19,731,329
-
5,511,369
182,224,920
28,122,929
1,104,272,778
160,423,585
466,576,347
239,582,923
13,655,752
6,231,244
391
11,646,271
13,277,839
55,413,586
19,191,547
24,680,051
96,201
5,511,369
                                 1,870,052,932
  204,352,453
  126,685,093
  2,201,090,478
    Description
  31 December 2022
   Stage 1 USD
   Stage 2 USD
   Stage 3 USD
  Total USD
                                  14,474,344
 8,685,372
 106,657,539
 129,817,255
 Equity investment
        12,232,623
            142,049,878
 REINVIGORATING THE PRIVATE SECTOR TO SHAPE A BETTER FUTURE 131
